
In addition to social distancing measures, suppression of SARS-CoV-2 depends on surveillance testing and quarantine of infected individuals to break chains of transmission within a population. By identifying and isolating symptomatic, presymptomatic, and asymptomatic spreaders, it is possible to repeatedly push the reproduction number (R0) in an environment to a level that significantly lessens the spread, despite potential reintroduction into a population from community transmission. In addition, repeat testing of a population is robust to potential false negatives (due to analytical limitations) as well as population non-compliance.1
Surveillance testing
Suppression of viral spread requires reducing R0 below 1. If R0 is below 1, then viral spread collapses.2 50 – 90% of the spread of SARS-CoV-2 is currently estimated to originate from asymptomatic and presymptomatic infected individuals.3,4,5,6 For presymptomatic individuals, the infection period prior to symptoms is estimated to be up to 5 days.7,8 Left undetected, a typical asymptomatic individual may remain infectious for 14 days.3 Due to these unique characteristics, SARS-CoV-2 spreads rapidly in uncontrolled environments. To prevent rapid spread, surveillance testing at regular time intervals, with self-quarantine of infectious individuals, can lower the R0 to below 1.1, 9, 10
Modeling approach
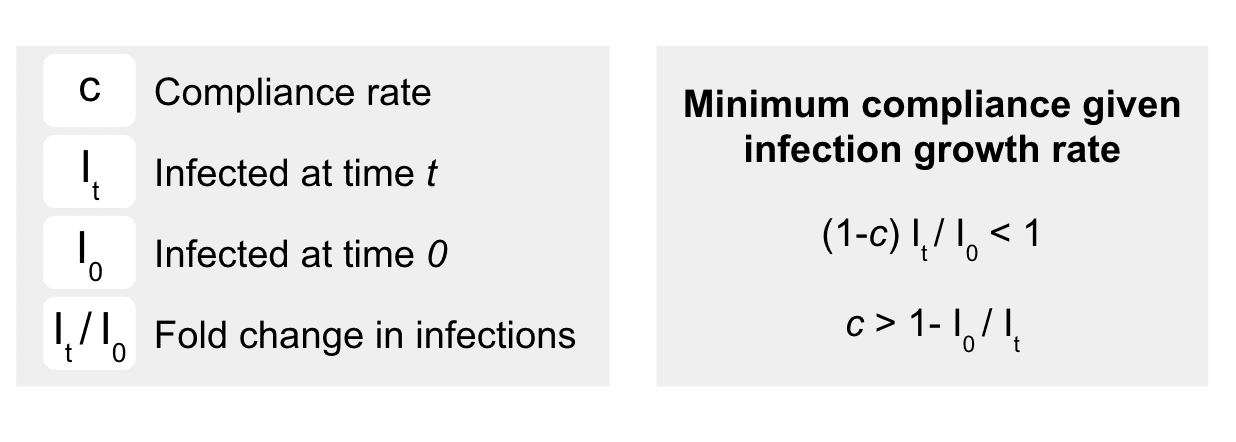
We use an SIR (Susceptible, Infected, and Removed) model to estimate the fold change in infections (It) over both a variety of R0 values and different surveillance intervals (i.e., daily, weekly, bi-weekly, monthly). While surveillance testing can identify symptomatic, presymptomatic, and asymptomatic infections, it is possible testing will not identify all positive cases due to analytical test performance (sensitivity) or biology. In addition, not all individuals will test each cycle, or self-quarantine appropriately. Perfect detection and full compliance, however, are not necessary to keep R0 below 1 for many infection spread scenarios. The minimal total compliance is the total compliance fraction (c) that keeps the increase in infections over an interval of time t (It/I0) from the non-compliers (i.e., 1- c) to less than one.1
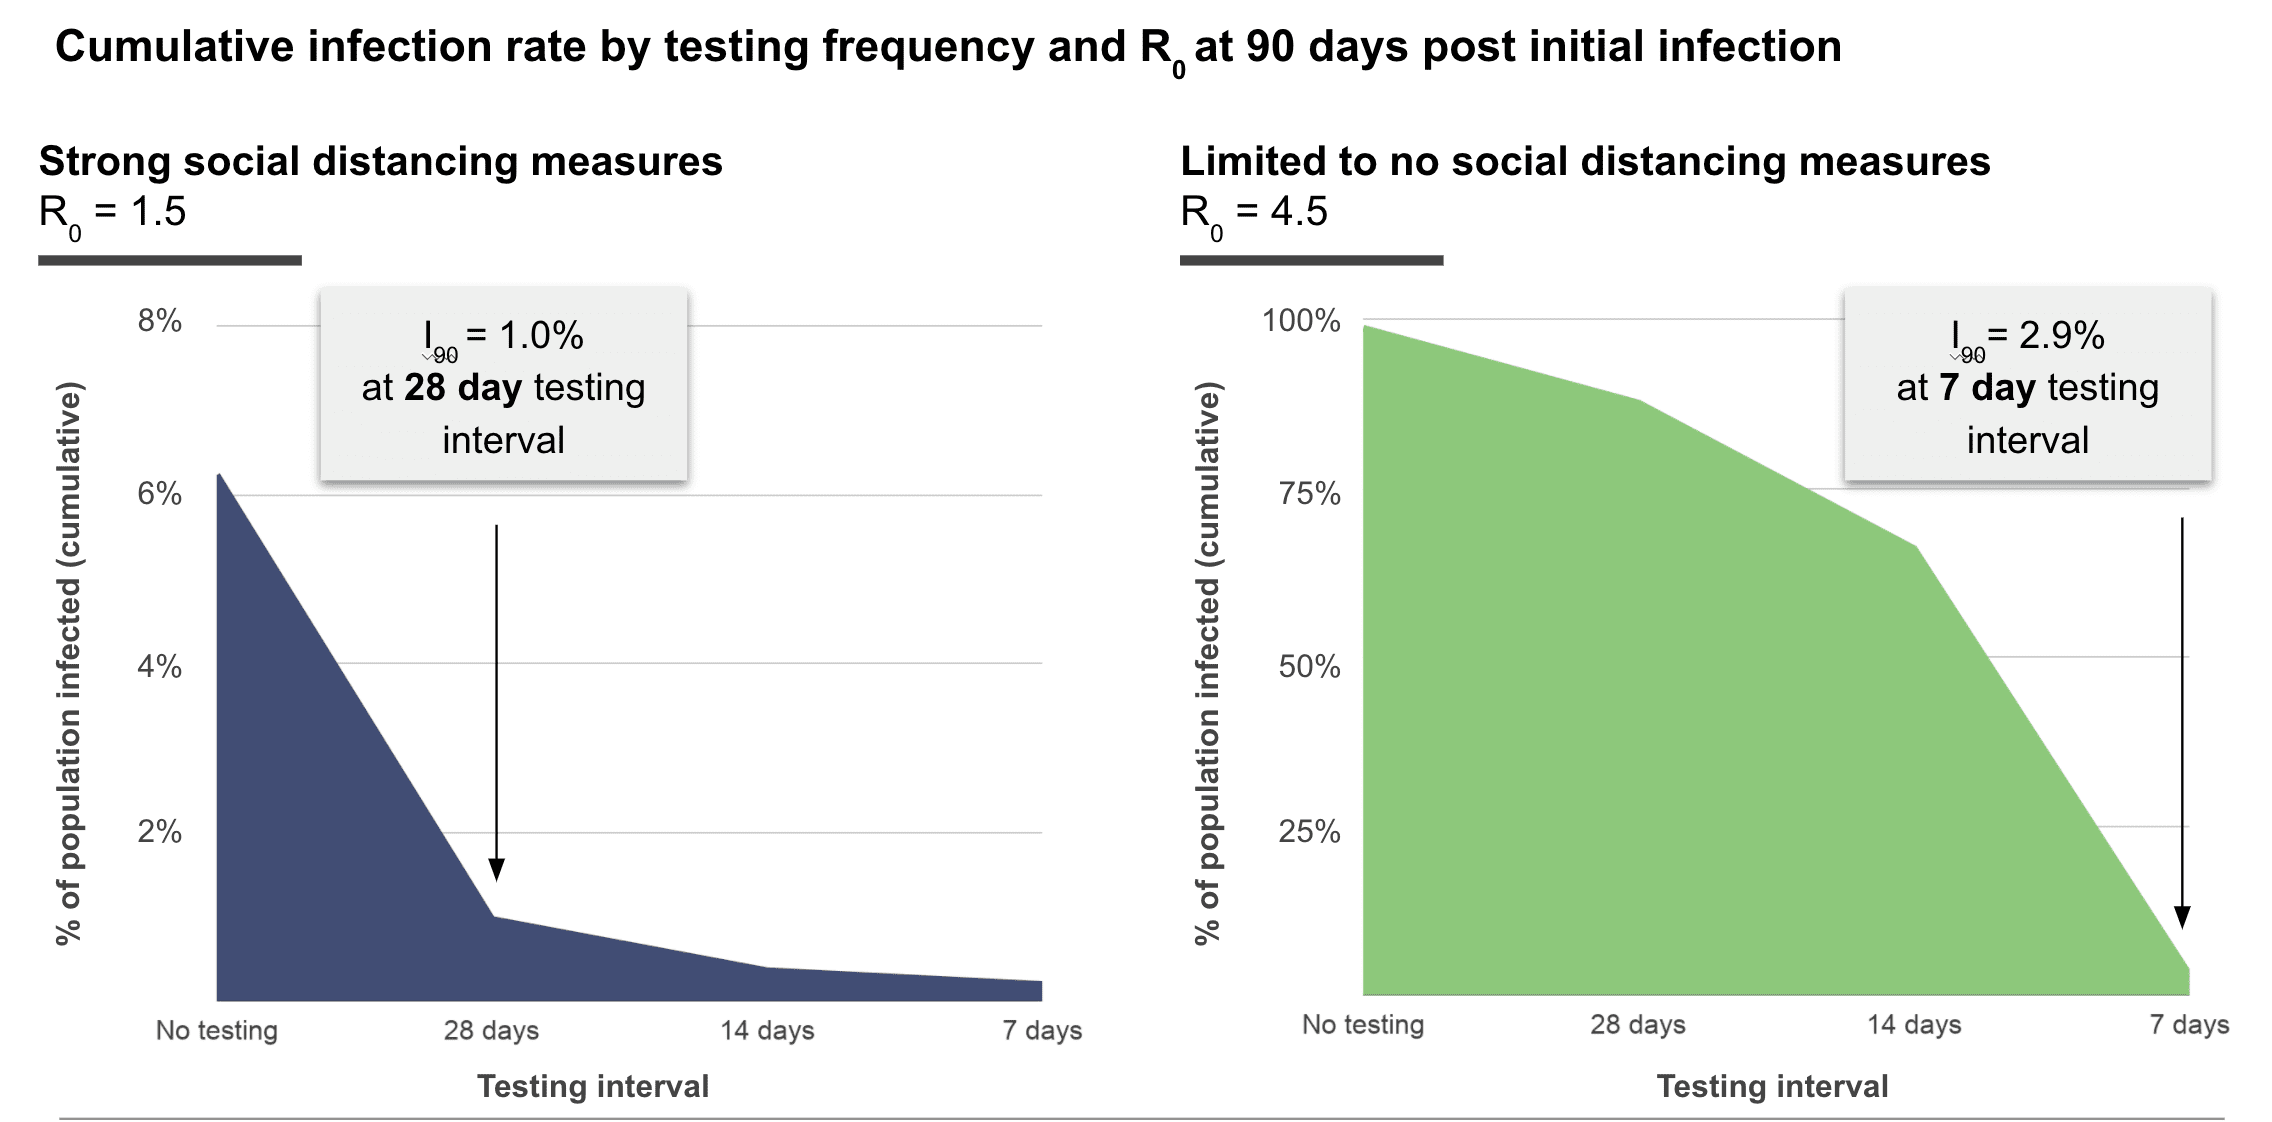
We model the relationship between total compliance (c) and fold change in infections (It/I0) to determine the ideal testing frequency to keep an infection rate of 0.1% (I0 = 1 in 1000) from growing substantially for each time period between testing intervals (Figure 1), for different rates of community transmission with reasonable compliance (c = 0.80). We model an optimistic scenario where social distancing is implemented and R0 is 1.5, where we find that monthly testing is sufficient to suppress outbreaks (Figure 1, blue). To provide a worse case estimate, we model an uncontrolled scenario where R0 is 4.5. This is close to the upper-bounded CDC estimate where R0 is 4.7 when few social distancing measures are implemented.11 In our model, implementation of repeat weekly testing (Figure 1, green), rapidly suppresses outbreaks.
Limitations
Our models are limited to closed populations; however, in reality, we may expect all groups to interact, in some form, with the broader community. These interactions may lead to the continuous reintroduction of SARS-CoV-2 into your population. Surveillance testing can nevertheless be used to control these exposures; if reintroduction rates are expected to be high, outbreaks can be suppressed by testing at a higher frequency than that required in the absence of reintroductions. Otherwise, if the rate of transmission from the broader community is expected to be low, the model described above offers a reasonable prediction of infection dynamics.
The model also assumes all positive cases are detected and isolated via surveillance screening. However, it is likely that in the period between surveillance screenings, diagnostic testing would be provided for symptomatic individuals to diagnose and quarantine infections as they arise. These actions will lower the level of community infection predicted by the surveillance-testing-only scenario and, in effect, allow for longer time intervals between surveillance tests.
It is likely that different subsets of your community have different levels of risk of infection. For example, some parts of your population may be involved in congregate settings where social distancing is not possible. Stratifying testing frequency based on risk may lead to better, targeted, testing; however the trade-off is a more complex surveillance testing schedule.
R0 is a difficult value to estimate. Further, R0 is a ratio not a rate and cannot be used to directly estimate change in infections over time.12 In an SIR model, R0 is calculated using the selected contact rate (beta) and infectious period (gamma) of the infection, both of which are difficult values to accurately determine. To account for this uncertainty, we have modeled several infection scenarios and used the variability from these solutions to contextualize our recommendations. The true R0 for SARS-CoV-2 in each community will differ and may be difficult to estimate before testing data has been collected over a reasonable time period.
Conclusions
Weekly testing enables rapid suppression of outbreaks even with widespread community transmission. Control of outbreaks through social distancing and surveillance testing lead to further reductions in testing frequency. By choosing a threshold for percent of positive cases, it is possible to evaluate week-to-week infection rate and reduce testing frequency as community transmission risk reduces. In populations with regular community reintroduction and minimal social distancing, weekly testing will likely be required. If social distancing measures are adopted, and community transmission drops, then surveillance testing can be reduced to biweekly or monthly. In all scenarios, if positive tests exceed the target threshold for positive cases during a given window, surveillance testing should return to a weekly testing cadence to reestablish control until the percentage of infected individuals in the population stabilizes.
References
1. Taipale, Jussi, Paul Romer, and Sten Linnarsson. 2020. “Population-Scale Testing Can Suppress the Spread of COVID-19.” Epidemiology. medRxiv. https://doi.org/10.1101/2020.04.27.20078329.
2. Diekmann, O., J. A. Heesterbeek, and J. A. Metz. 1990. “On the Definition and the Computation of the Basic Reproduction Ratio R0 in Models for Infectious Diseases in Heterogeneous Populations.” Journal of Mathematical Biology 28 (4): 365–82.
3. Oran, Daniel P., and Eric J. Topol. 2020. “Prevalence of Asymptomatic SARS-CoV-2 Infection: A Narrative Review.” Annals of Internal Medicine, June. https://doi.org/10.7326/M20-3012.
4. Ferretti, Luca, Chris Wymant, Michelle Kendall, Lele Zhao, Anel Nurtay, Lucie Abeler-Dörner, Michael Parker, David Bonsall, and Christophe Fraser. 2020. “Quantifying SARS-CoV-2 Transmission Suggests Epidemic Control with Digital Contact Tracing.” Science 368 (6491). https://doi.org/10.1126/science.abb6936.
5. He, Xi, Eric H. Y. Lau, Peng Wu, Xilong Deng, Jian Wang, Xinxin Hao, Yiu Chung Lau, et al. 2020. “Temporal Dynamics in Viral Shedding and Transmissibility of COVID-19.” Nature Medicine 26 (5): 672–75.
6. Li, Ruiyun, Sen Pei, Bin Chen, Yimeng Song, Tao Zhang, Wan Yang, and Jeffrey Shaman. 2020. “Substantial Undocumented Infection Facilitates the Rapid Dissemination of Novel Coronavirus (SARS-CoV-2).” Science 368 (6490): 489–93.
7. Arons, Melissa M., Kelly M. Hatfield, Sujan C. Reddy, Anne Kimball, Allison James, Jesica R. Jacobs, Joanne Taylor, et al. 2020. “Presymptomatic SARS-CoV-2 Infections and Transmission in a Skilled Nursing Facility.” The New England Journal of Medicine 382 (22): 2081–90.
8. Lauer, Stephen A., Kyra H. Grantz, Qifang Bi, Forrest K. Jones, Qulu Zheng, Hannah R. Meredith, Andrew S. Azman, Nicholas G. Reich, and Justin Lessler. 2020. “The Incubation Period of Coronavirus Disease 2019 (COVID-19) From Publicly Reported Confirmed Cases: Estimation and Application.” Annals of Internal Medicine 172 (9): 577–82.
Larremore DB, Wilder B, Lester E, Shehata S, Burke JM, Hay JA, et al. Test sensitivity is secondary to frequency and turnaround time for COVID-19 surveillance. Infectious Diseases (except HIV/AIDS). medRxiv; 2020. doi:10.1101/2020.06.22.20136309
9. Peto J, Carpenter J, Smith GD, Duffy S, Houlston R, Hunter DJ, et al. Weekly COVID-19 testing with household quarantine and contact tracing is feasible and would probably end the epidemic. Royal Society Open Science. 7: 200915.
10. Steven Sanche, Yen Ting Lin, Chonggang Xu, Ethan Romero-Severson, Nick Hengartner, and Ruian Ke. 2020. “High Contagiousness and Rapid Spread of Severe Acute Respiratory Syndrome Coronavirus 2.” Emerging Infectious Disease Journal 26 (7). https://doi.org/10.3201/eid2607.200282.
11. Paul L. Delamater, Erica J. Street, Timothy F. Leslie, Y. Tony Yang, and Kathryn H. Jacobsen. 2019. “Complexity of the Basic Reproduction Number (R0).” Emerging Infectious Disease Journal 25 (1):1