We want to thank everyone who has contributed data to this study—thanks to your willingness to help, we are making progress!
COVID-19 is a prominent yet mysterious disease. Alongside a rising case number, researchers and physicians have found themselves asking more questions than we can answer. Why does SARS-CoV-2, the virus that causes COVID-19, affect some people so severely? What, exactly, are the symptoms that define COVID-19? And why, or how, are some people able to avoid infection altogether?
Researchers around the world set to work answering these questions. Many of them, including those of us at Helix, reasoned that small differences in people’s DNA may be playing a role.
To help shed light on this, we sent an invite out to the Helix community to participate in a COVID-19 survey which asked participants if they had developed certain symptoms, if they had been diagnosed with COVID-19, and several other questions related to their medical history and behavior during the pandemic. Our goal is to better understand COVID symptoms and severity of infection in our population by combining survey responses with genetic data—all collected using the Exome+ assay prior to the survey.
We’ve now had more than thousands of survey responses! Our team of researchers are currently working through the data, but we have already found some interesting insights in our collection of survey responses, and we’ve contributed our findings to a worldwide research effort, consisting of renowned scientists from around the globe. These results, described below, highlight the power of population health studies and the impact of sharing information early and often.
As we make more discoveries, we’ll continue to update our blog and our research community. If you have already participated in our survey, we’ll be contacting you periodically with a follow-up survey to see how your symptoms or exposures may have changed. We’re grateful for your time and effort!
Note: The data below comes from survey responses. We discuss our genetic findings at the end of this blog, and will release more details in the coming months. It is also important to remember that these findings are preliminary and may change as we gather more data.
Common symptoms in people with COVID-19
One important area of our research is focused on identifying symptoms that might indicate a person has COVID-19, even without a definitive diagnosis. With a national shortage in tests, it’s important for physicians and researchers to be able to accurately recognize people who likely have (or had) COVID-19 but who haven’t yet been tested.
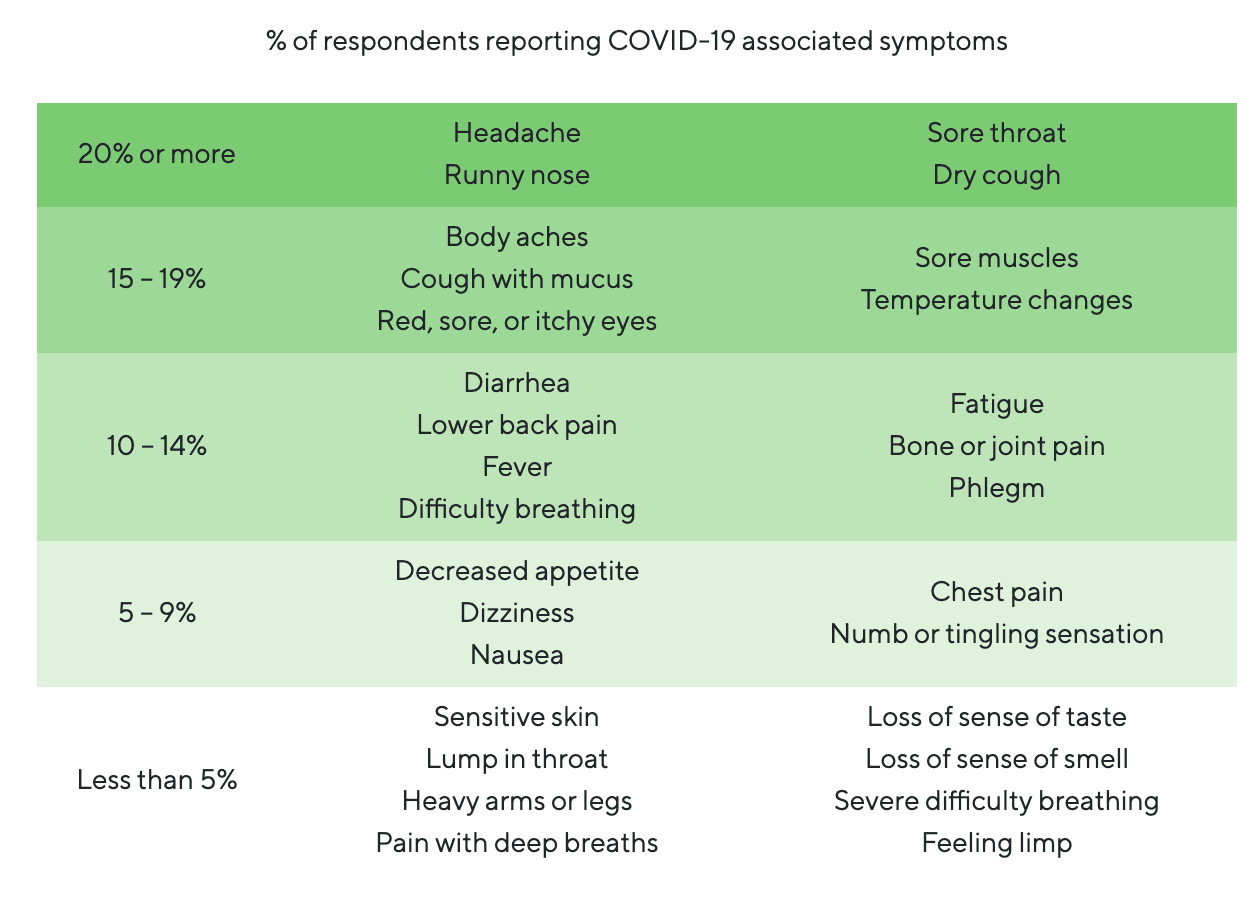
To this end, we analyzed data from survey responses focused on 29 symptoms that have been reported in relation to COVID-19. The chart below shows the prevalence of each of these symptoms across all survey participants. You’ll notice that many of these symptoms are commonly reported, including widely recognized (or signature) COVID-19 symptoms like “dry cough”, which is reported by nearly 20% of all survey-takers, regardless of whether they’ve had COVID-19. This suggests that, although “dry cough” may be a signature symptom of COVID-19 infection, it’s too commonly reported (likely for non-COVID-19 related reasons) to discriminate between those who have or likely had COVID-19 from those who haven’t. On the other hand, symptoms that are reported much less frequently, such as loss of taste and smell (which are both reported by less than 3% of participants overall) have the potential to help us differentiate between those who have or likely had COVID-19 from those who haven’t.
With overall frequencies in mind, to identify symptoms more commonly found in people who have been diagnosed with COVID-19, we focused on the symptoms reported by the 238 people who said they had taken a COVID-19 test. The symptoms enriched in people who tested positive vs. those who tested negative are displayed in the chart below.
Loss of taste or smell
There are a number of differences between people who said they had tested positive for COVID-19 and those who tested negative. Between these groups, there were a few symptoms that appeared much more frequently in people who tested positive, suggesting that these symptoms may be an important indicator of SARS-CoV-2 infection.
One of those symptoms is losing the ability to taste or smell, which occurred in 48% of people who tested positive for COVID-19, but only in 9% of people who tested negative—meaning people who tested positive for COVID-19 were approximately 6 times as likely to report a loss of taste or smell compared to people who tested negative. This symptom is rarely reported at the population level (3% of all survey-takers), making it very specific to COVID-19 infection. This is an important observation because, in combination with reports from other labs, it adds to mounting evidence that the loss of taste and/or smell is a strong indicator of COVID-19 infection.
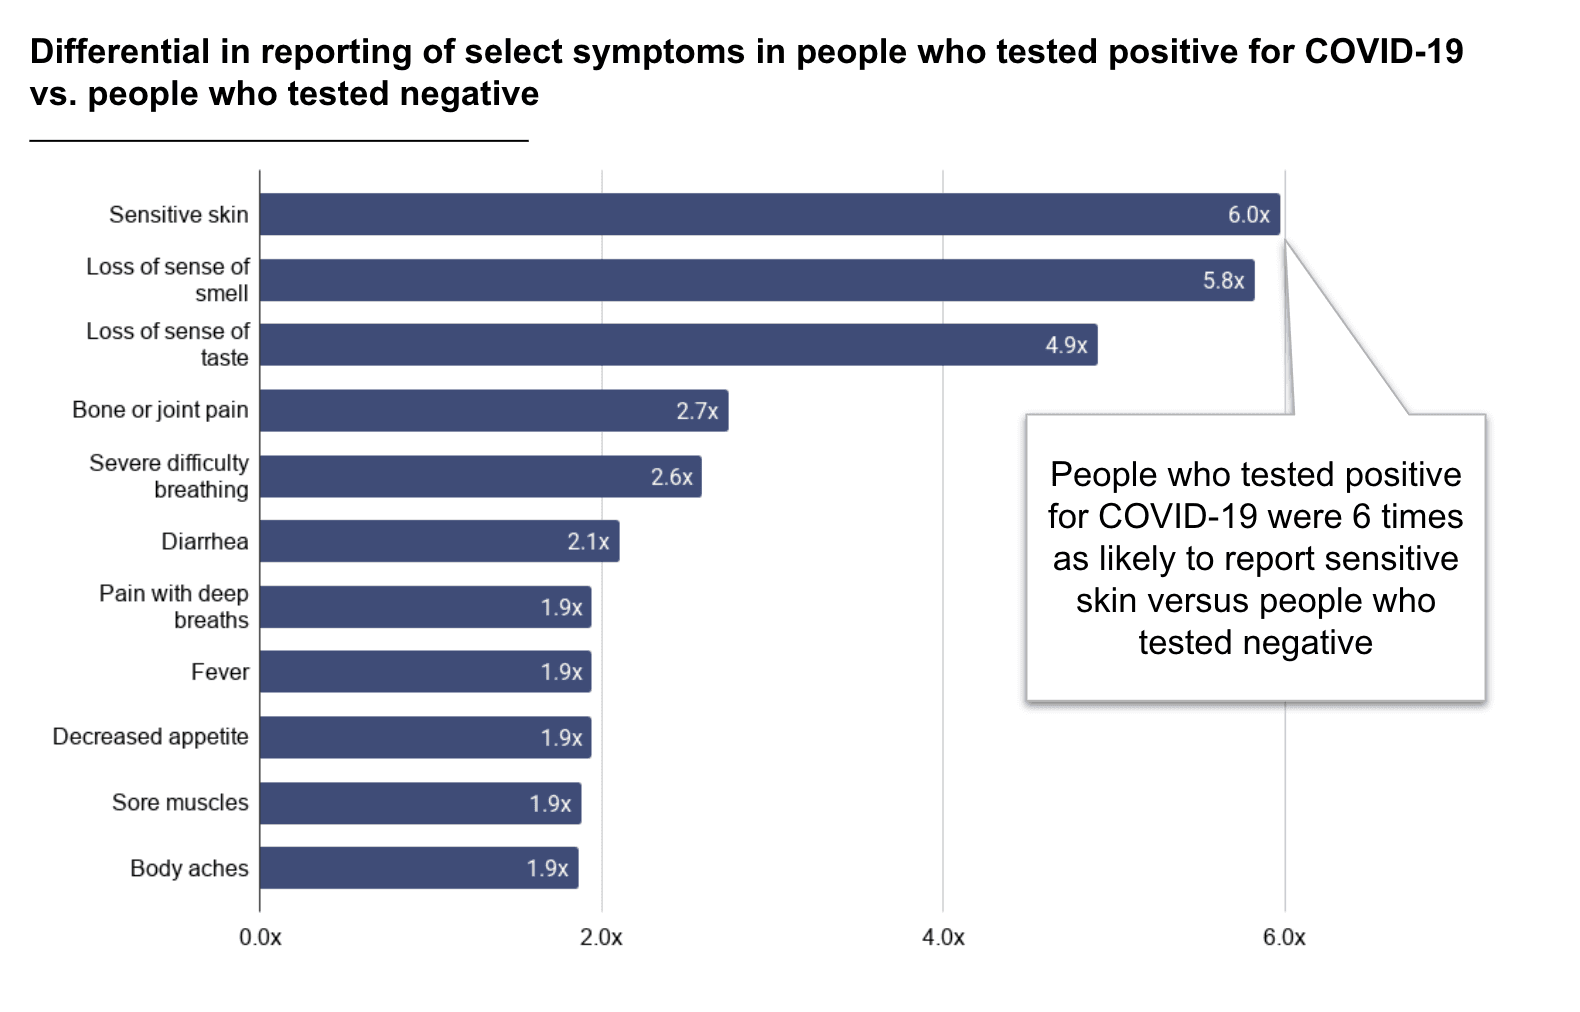
Shown is the fold increase of people reporting each symptom in positive COVID-19 cases versus those with a negative COVID-19 test result.
A potential new COVID-19 symptom: Sensitive skin
We were excited to see a previously unreported, but significant, finding in our data: People who tested positive for COVID-19 reported experiencing sensitive skin much more frequently than people who tested negative (40% vs 7%). This represents an approximately 6-fold enrichment, making it similarly as predictive of COVID-19 as the loss of sense of taste or smell symptom. Prior to the pandemic, having sensitive skin, unlike a dry cough, wasn’t a commonly reported symptom, which means it’s more likely that this symptom is somehow related to SARS-CoV-2 infection.
Additionally, we observed that sensitive skin is not closely correlated with loss of taste or smell, meaning it’s an independent predictor of a COVID-19 infection: 56% of the individuals with a positive COVID-19 diagnosis who reported these symptoms reported only one of the two and not both.
Novel findings such as this may ultimately help scientists and physicians identify people who currently have, or may have previously had, COVID-19 but are unable to get tested to confirm their diagnosis. Our contribution of this finding to the COVID-19 Host Genetics Initiative global effort was met with enthusiasm by many researchers, and several projects will be including this symptom in forthcoming surveys in order to confirm our analysis.
Trends in preventative measures and COVID-19 symptoms
Our survey also asked participants about preventative measures they may be taking. This information helps us gauge a person’s possible exposure level and, as the data below demonstrates, highlights various trends in COVID-19 vulnerability.
Behaviors
We were encouraged to learn that most participants in our study are following the recommended precautions during this time. 91% of the respondents indicated that they were currently observing a shelter-in-place or self-isolation policy, 97% of whom had been doing so for more than 2 weeks. 99% of the participants also reported that they were using some safety precautions when they go out in public, with 94% staying at least 6 feet from others, 90% performing frequent hand washing, and 79% wearing masks.
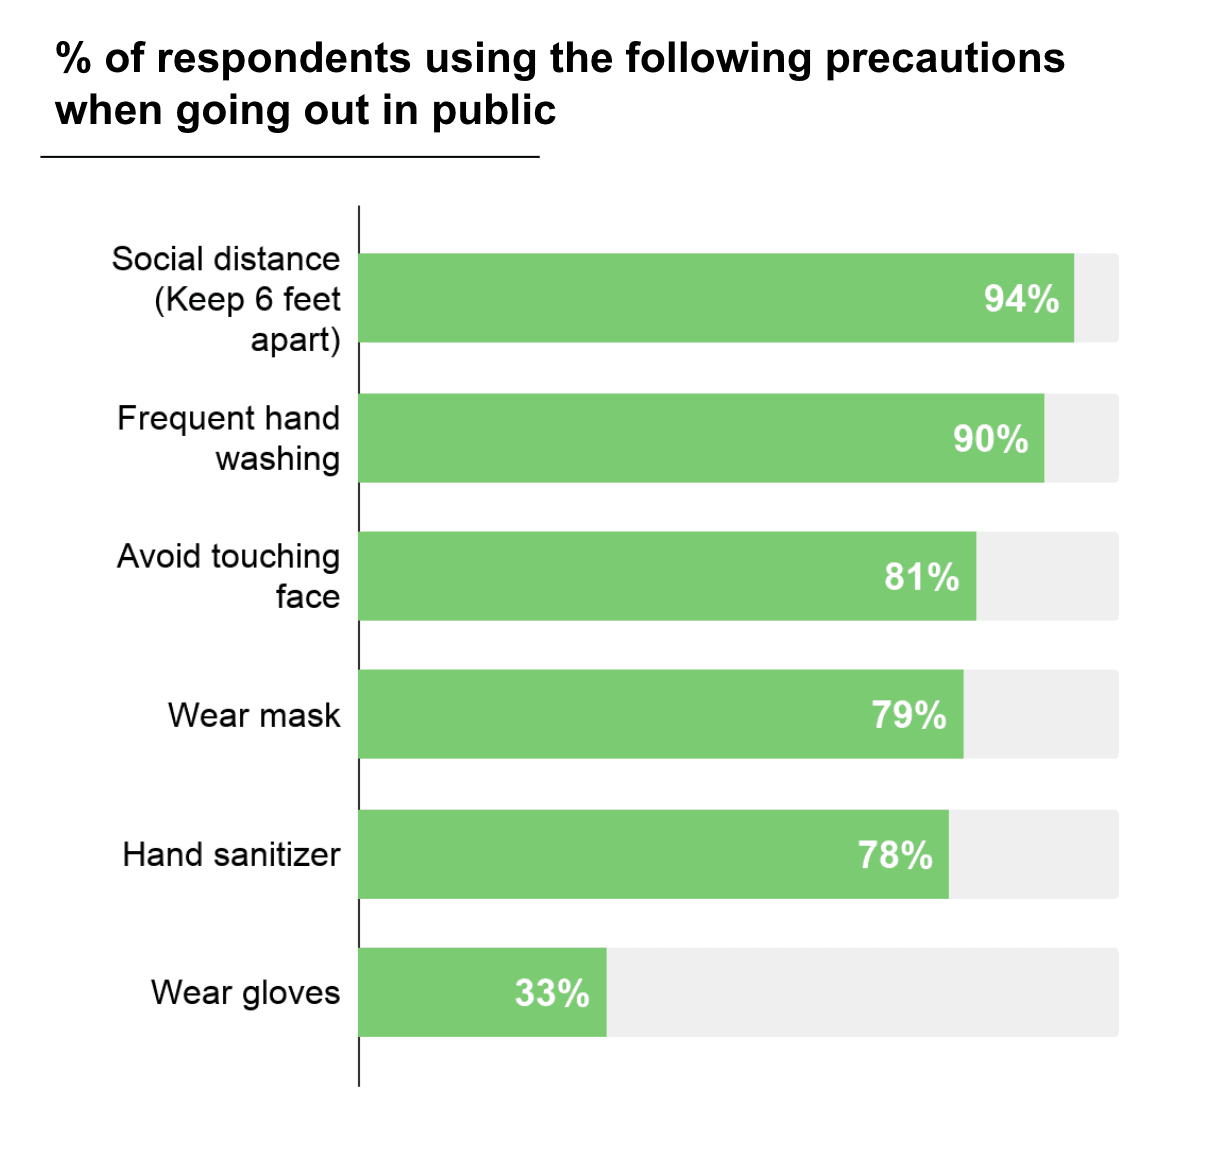
Shown is the proportion of people from our survey who report using these precautions when they go out in public
We also learned that 18% of respondents are essential workers who were still physically going in to work during the shelter-in-place time period, 32% of whom are healthcare workers. A big thank you to these workers, who are keeping people fed, our cities strong, and helping those who do get sick.
Thanks to your efforts, you are positively impacting our society’s fight against this virus. Every precaution taken to decrease the spread of infection will help to “flatten the curve” by sparing our medical staff from being overwhelmed and helping to give the world’s scientists time to develop treatments and a vaccine.
Potential effect of public health measures
In mid-March, many states around the nation began to shelter-in-place in an effort to limit the spread of COVID-19 and flatten the curve. But how effective has this effort been? From our data, the implementation of shelter-in-place efforts correlates with a decrease in the proportion of respondents who reported having symptoms associated with COVID-19. In the graph below, you can see that the timing of when people first reported COVID-19-associated symptoms among our community increased to a peak around the week of March 9th, followed by a sharp decline.
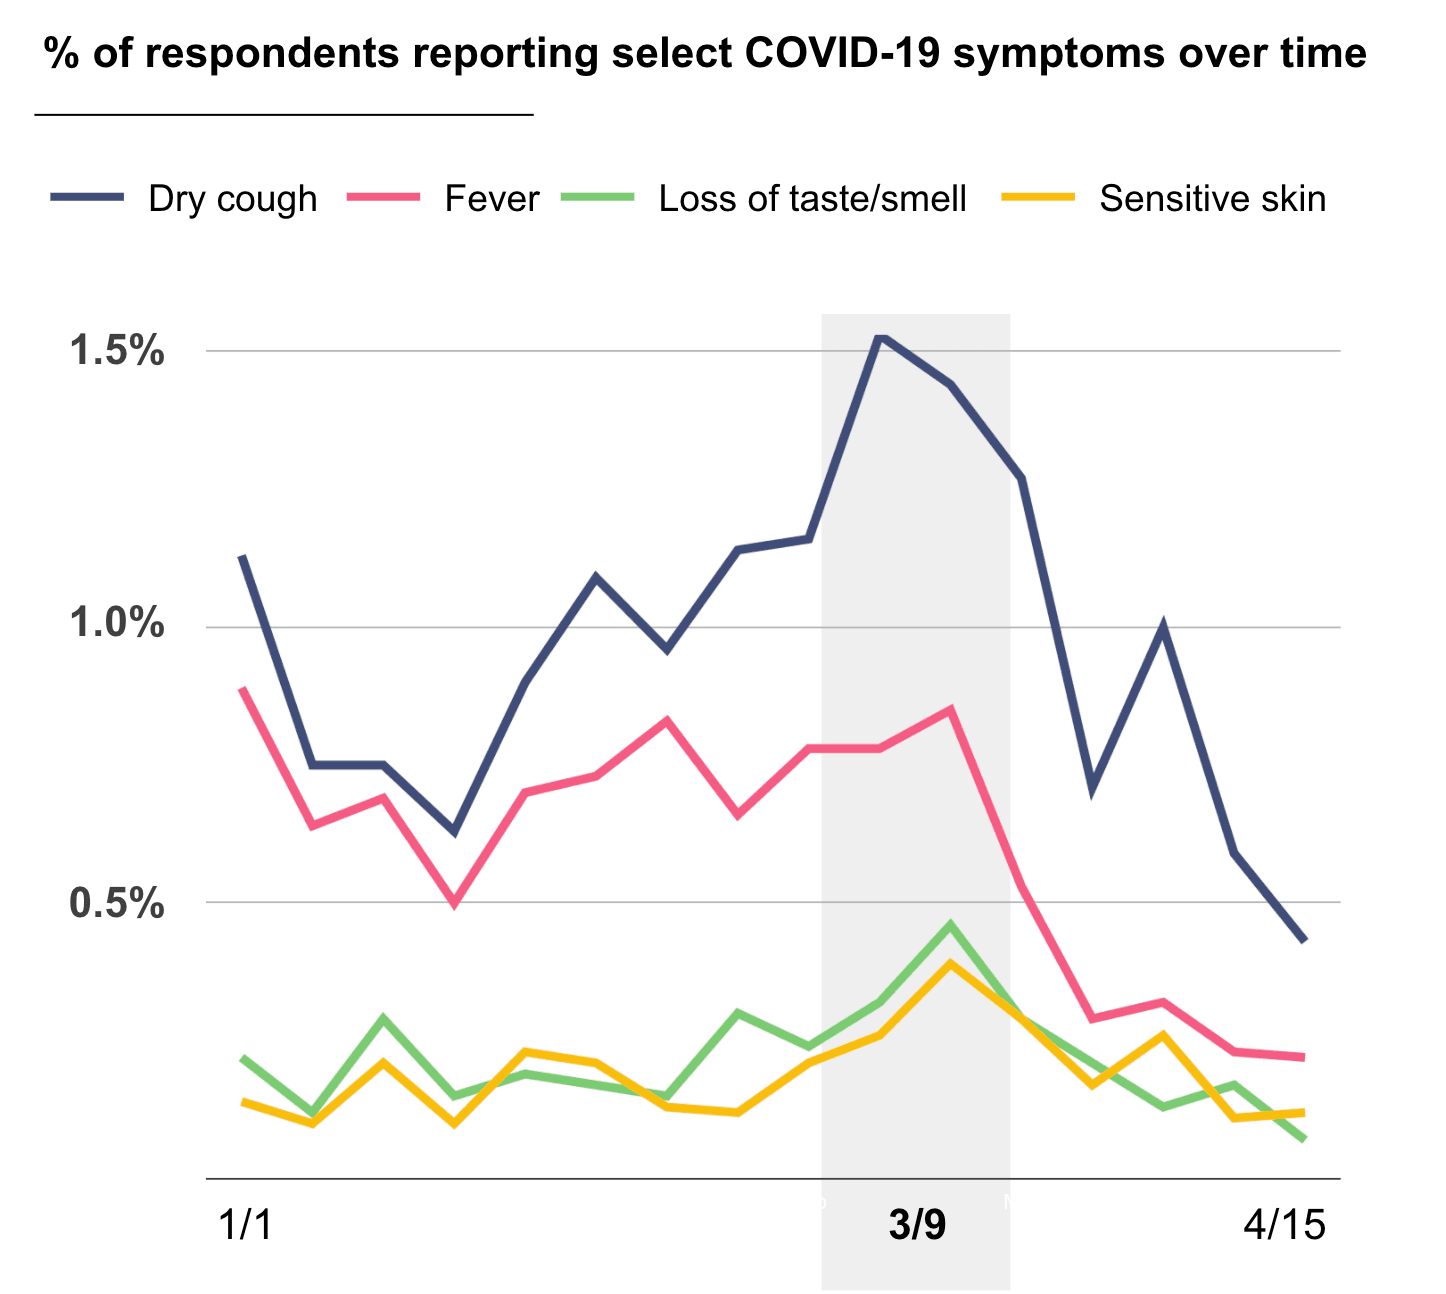
Shown are the percentages of respondents reporting the start of selected COVID-19-related symptoms during the time period surveyed. Only symptom start dates are shown, and not their continuation. Data are aggregated over each week, with each vertical line representing one week.
The timing of this decline correlates with increasing public health measures. It should be noted, too, that several factors are at play which may explain this decline, so we cannot make a firm conclusion based solely on our data. However, this correlation does support other evidence that social distancing and shelter-in-place orders are having a strong effect in limiting the spread of COVID-19. As many states are starting to loosen stay-at-home orders and are starting phased re-opening of businesses, ongoing and periodic collection of self-reported data related to COVID-19 is essential to understand how these measures are affecting population risk– especially since symptoms will likely peak before hospitalizations.
Fortunately, we can help with this. Over the next few months, we’ll be sending out follow up surveys to the Helix research community. These surveys will aim to check in with survey respondents and give them space to report any new symptoms or other COVID-19 related information. By continuing to engage with these surveys, respondents will be playing an important role in our assessment of COVID-19 and its spread through our communities.
Who is more likely to test positive for COVID-19?
Finally, we looked at what differences exist between people with and without COVID-19. Shown below is the proportion of respondents who had or are likely to have had COVID-19 compared to the variables of age, sex, ethnicity, and other factors.
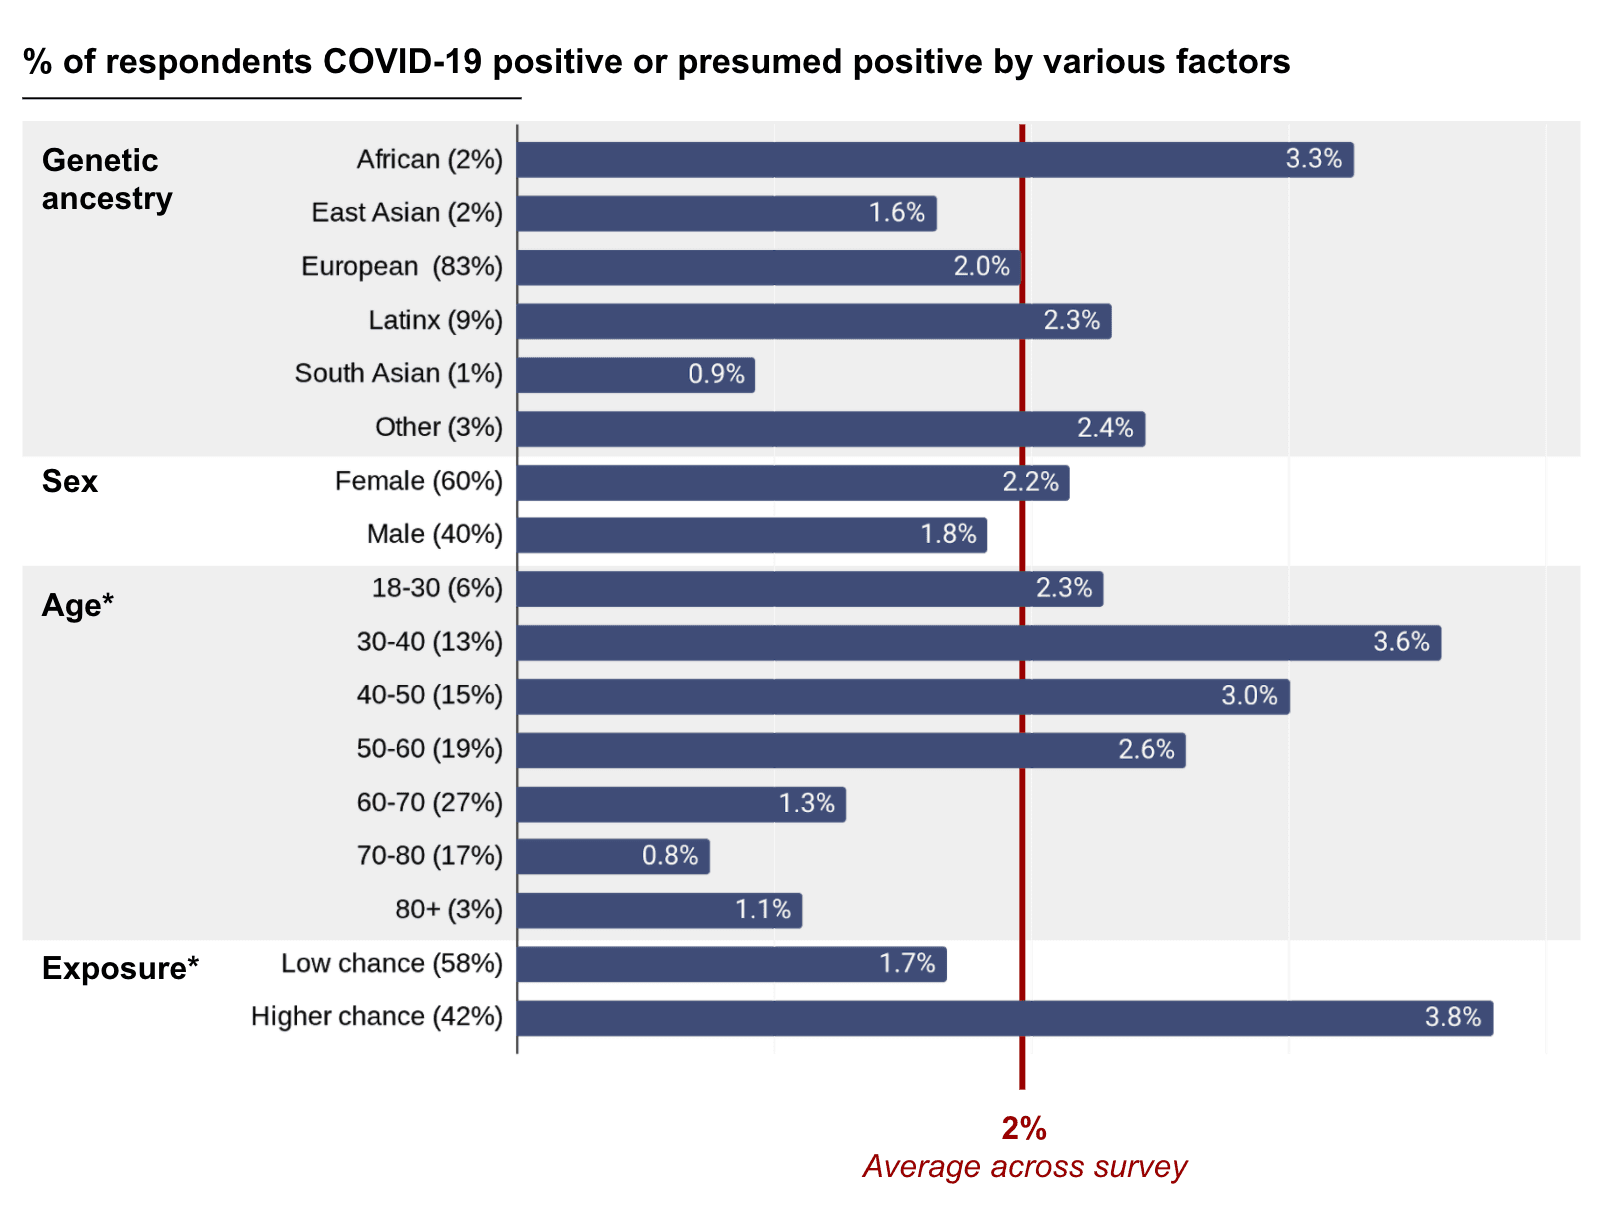
Y-axis labels show different subcategories and percentage of all respondents who fell into each subcategory. X-axis shows percentage of respondents within each subcategory who tested positive for COVID-19 or were predicted to be positive based on a published model—modified to remove age and sex (which did not substantially change the predictive performance), with the final percentage corrected by the positive predictive value. These results are preliminary and should be interpreted with caution. Only age and exposure, marked with an *, showed statistically significant differences. High-exposure was defined as healthcare workers, essential workers, people living with essential workers, and people with specific exposure events such as being in the same room as someone with a COVID-19 diagnosis.
We observed differences in COVID-19 infection rate based on genetic ancestry, with people of predominantly South Asian ancestry having the lowest prevalence, while people with predominantly African ancestry had the highest. This trend is not statistically significant, meaning that our observed difference in COVID-19 rate among ancestries could be explained by random chance. However, the observations are in line with what has been seen in other studies. Since there are many factors at play here, including socio-economic status, that may affect the rate of COVID-19 among different ancestries, more research is needed to understand why these associations may exist.
Previous work by other research teams had found associations between a person’s blood type and their likelihood of developing COVID-19; however, our data did not support this association. We also found no evidence to suggest that people who had received a flu shot or TB vaccine were more or less vulnerable to COVID-19 infection, consistent with other emerging studies. We do, however, find differences in COVID-19 positivity by age and by likelihood of exposure to COVID-19.
Next steps
Our results so far have given us some interesting, albeit high level, insights into the COVID-19 pandemic. We have also completed a thorough genetic analysis and combined our results with findings from other research teams around the world. From this analysis, one thing is clear: There isn’t likely to be just one marker in a person’s DNA that makes them more or less vulnerable to COVID-19; instead, it’s likely that a combination of many genetic and environmental factors determines if you’re more or less likely to develop COVID-19.
But what are those factors? And how could knowing about these factors help us improve public health? To answer these questions, much more research is needed.
Our team will continue to work with the research community to collect and analyze more data. We hope that these efforts will shed more light on COVID-19, why some people are more vulnerable to it, and why some people recover while others do not. We’ll continue to make our findings accessible to as wide an audience as we can, so please check the Helix blog periodically for more updates!
If you’ve been sequenced by Helix and would like to join our research community, follow the instructions found in this FAQ.
Supplemental material
Symptoms reported in the COVID-19 survey
| Symptom | Overall | Negative Test | Positive Test |
|---|---|---|---|
| None | 42% | 17.5% | 8.0% |
| Headache | 28% | 52.6% | 64.0% |
| Runny Nose | 26% | 36.6% | 40.0% |
| Sore throat | 23% | 45.9% | 36.0% |
| Dry cough | 20% | 41.2% | 60.0% |
| Body aches | 19% | 38.7% | 72.0% |
| Cough with mucus | 19% | 34.5% | 20.0% |
| Red, sore or itchy eyes | 16% | 21.1% | 28.0% |
| Sore muscles | 15% | 32.0% | 60.0% |
| Temperature fluctuations | 15% | 37.1% | 48.0% |
| Diarrhea | 13% | 24.7% | 52.0% |
| Lower back pain | 13% | 19.6% | 24.0% |
| Fever | 12% | 28.9% | 56.0% |
| Difficulty breathing | 12% | 39.7% | 40.0% |
| Fatigue | 11% | 30.4% | 52.0% |
| Bone or joint pain | 10% | 17.5% | 48.0% |
| Phlegm | 10% | 19.6% | 16.0% |
| Decreased appetite | 9% | 24.7% | 48.0% |
| Dizziness | 9% | 15.5% | 16.0% |
| Nausea | 8% | 17.5% | 24.0% |
| Chest pain | 7% | 20.6% | 13.4% |
| Numb or tingling sensation | 6% | 13.4% | 16.0% |
| Sensitive skin | 4% | 6.7% | 40.0% |
| Lump in throat | 4% | 8.2% | 12.0% |
| Heavy arms or legs | 4% | 9.3% | 4.0% |
| Pain with deep breaths | 4% | 14.4% | 28.0% |
| Loss of sense of taste | 3% | 9.8% | 48.0% |
| Loss of sense of smell | 3% | 8.2% | 48.0% |
| Severe difficulty breathing | 1% | 4.6% | 12.0% |
| Feeling limp | 1% | 3.1% | 0.0% |