Executive summary
- Cq values correlate with viral load, which can vary by orders of magnitude during a single infection.
- We find that average Cq values fluctuated through most of the pandemic until mid-2022, after which they remained relatively stable at 24-25 (~105-106 GCE/mL).
- Average Cq values were their lowest at the beginning of the Delta wave (Cq value of 23, ~2x10⁶ GCE/mL), consistent with the Delta variant causing more severe disease.
Background
Throughout the COVID-19 pandemic, RT-qPCR tests have been used to diagnose whether an individual has detectable levels of SARS-CoV-2 virus. Although the binary diagnostic outcome from these tests has been widely tracked in public dashboards and datasets, the quantification cycle, or Cq/Ct value, corresponding to positive results is not widely reported.
The Cq value correlates with the amount of virus in a patient’s sample. Lower Cq values indicate high viral load and higher Cq values indicate low viral load. Cq values can vary widely within the course of a single infection (Figure 1). The temporal patterns of average Cq may therefore indicate overall disease transmissibility/severity, or the phase of the epidemic curve.
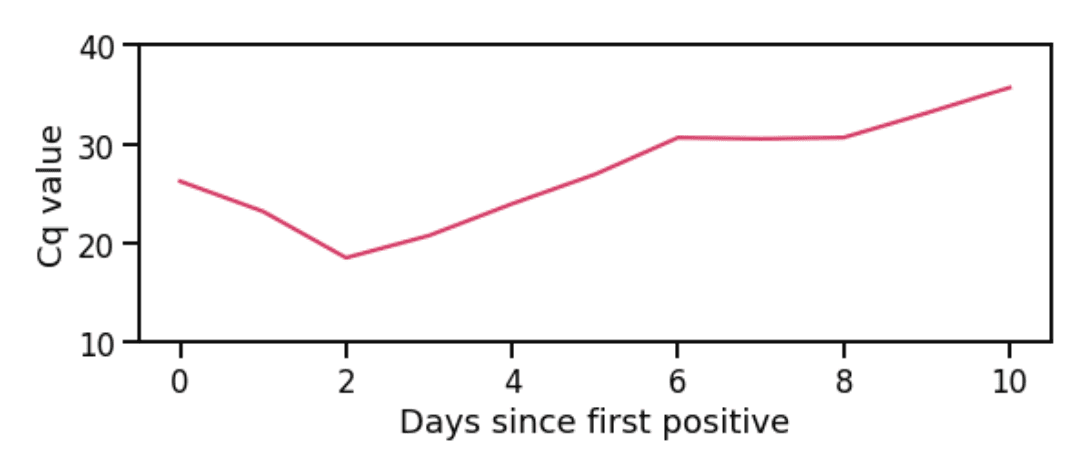
Figure 1: Cq values during one infection. Viral load initially increases (Cq value decreases), then decreases (Cq value increases). Not all patients test early enough to catch the initial decrease in Cq value; often, only the gradual increase in Cq values is observed.
Here, we perform a retrospective analysis of Cq values from tests conducted at a single laboratory to investigate whether fluctuations in their average values have coincided with new variants or with different epidemic phases.
Data source
This analysis uses 467,971 SARS-CoV-2 positive test results from 369,625 unique individuals in the United States who tested with Helix through pharmacy-based testing and received at least one positive result and a corresponding Cq value. Analysis is based on nasal swab specimens collected and sent to a single laboratory for processing between March 15, 2021 and January 1, 2023. See ‘Data Processing’ for additional details.
Cq values fluctuated throughout the pandemic
Figure 2 shows that average Cq values fluctuated across a wide range and through multiple epidemic waves. The Alpha, Delta, and Omicron (BA.1) waves exhibited a pattern where an initial decrease in average Cq value during the growth phase of the wave was followed by an increase. This pattern did not continue, however, with the second Omicron (BA.2, BA.4/BA.5) wave, during which average Cq values were relatively stable. Cq values remained relatively flat/slightly increasing at around 24-25, or 105-106 GCE/mL, through to the end of the dataset (beginning of 2023).
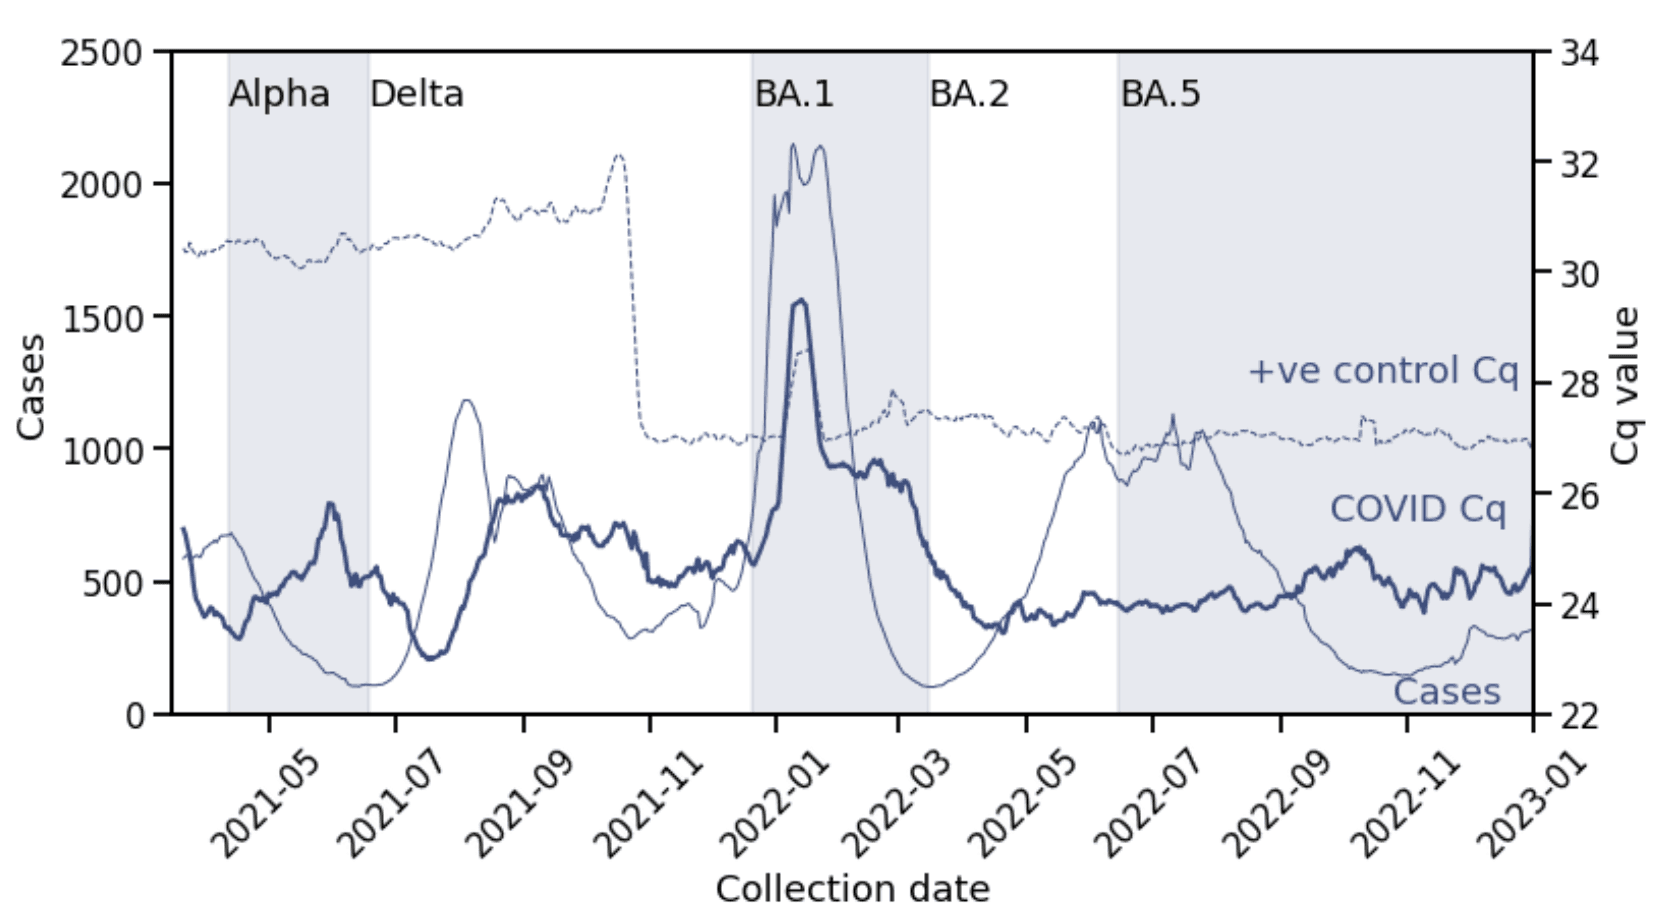
Figure 2: COVID-19 positive Cq values over time. Daily average Cq values of patient samples (thick line, right y-axis) compared with daily positive cases (thin line, left y-axis) and daily average Cq values for positive controls processed with patient samples (dashed thin line, right y-axis). Alternating shaded regions indicate periods of variant dominance (>50% prevalence). The sudden shift in positive control Cq values just before November 2021 was due a change in positive control type. The spike in Cq values in late January 2022 for both positive controls and patient samples was due to a temporary change in operations. All lines are 7-day rolling averages.
On the one hand, the repeated pattern supports findings that aggregate Cq values are impacted by the phase of the pandemic. Here, the changing composition of testers – skewed towards newly infected/low Cq in the growth phase and towards recovering/high Cq in the decline phase – manifests in the changing average Cq values for multiple waves.
On the other hand, by the second Omicron (BA.2, BA.4/BA.5) wave, testing behavior must have sufficiently changed so that the phase of the epidemic is not reflected in the testing population. We hypothesize that after the first Omicron (BA.1) wave, patients were primarily using laboratory based testing while symptomatic or early in their infection, rather than at a random time during infection as may occur with more asymptomatic screening, or with at-home tests.
To check that these fluctuations are indeed due to biology and not artifacts of the diagnostic test assay, we also plot average Cq values for positive controls processed with the patient samples in Figure 2 (thin dashed line).
Cq values were lowest during the Delta wave
The lowest values of average daily Cq occurred during the Delta wave (Figure 3), corresponding to 2x10⁶ GCE/mL. The minima during the Alpha and BA.2, BA.4/BA.5 waves were slightly higher, while for the BA.1 wave, it was two cycle thresholds higher, or 5x10⁵ GCE/mL. This is despite the BA.1 wave having the highest case growth rate of all four waves.
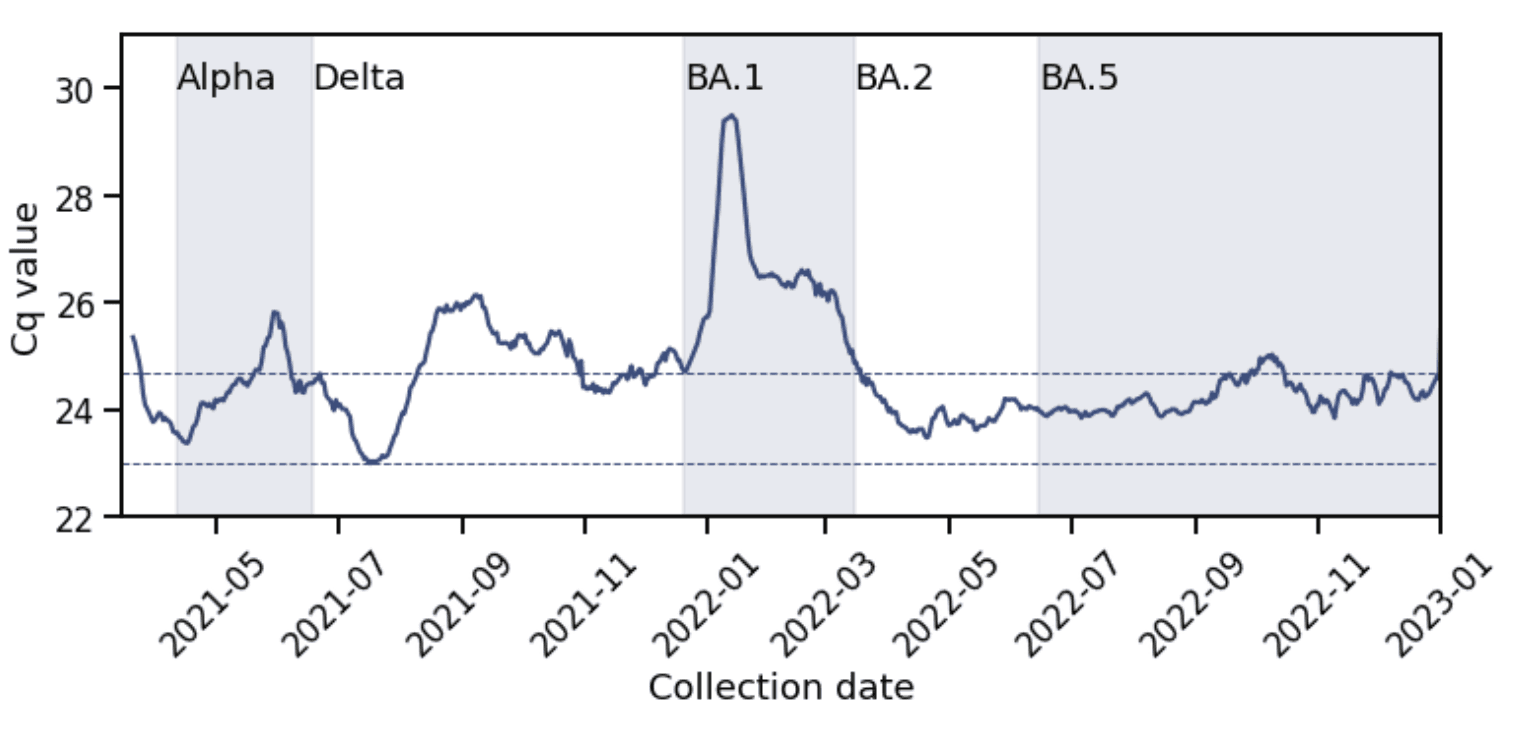
Figure 3: The Delta wave had the lowest average Cq value. The minimum average Cq value during the Delta wave was 23 (lower dashed line) and during the BA.1 wave was 25 (upper dashed line).
These observations are consistent with data from the US and France which also found that despite its higher transmissibility, Omicron BA.1 variants did not exhibit higher viral load than previous variants. This may be because viral infectiousness, measured in vitro in culture, is not directly correlated with viral RNA load, measured by RT-qPCR, so that a more infectious variant need not produce lower Cq values. However, disease severity is correlated with viral RNA loads. Thus, our observation that Delta infections had the lowest Cq values may reflect the higher severity of Delta infections.
Data processing
To avoid confounding due to multiple tests taken within the same infection, we removed test results that occurred within 4 weeks of the first positive test from the same patient. Thus, all the test data, with the exception of Figure 1, is based on the first positive test in an infection. This resulted in 380,041 test results from 369,625 unique patients (multiple test results for the same patient reflect multiple infections).
Helix’s RT-qPCR assay has a confirmed limit of detection for SARS-CoV-2 of 500 GCE/mL, corresponding to a Cq value of 35. Our estimates for GCE/mL units in the text are based on this calibration.
Prepared by Vanessa Chilunda and Shishi Luo. Special thanks to Simon White for pulling the data.
© Helix, Inc. 2023. All rights reserved.
Helix and the Helix logo are registered trademarks of Helix, Inc.